Acoustic representations of speech
FFT and LPC spectra
In speech analysis FFT's and LPC's are used for the accurate identification of the frequencies and relative intensities of the various components of the speech spectrum. For example, FFT's allow a close examination of the interaction between harmonic frequencies and formant frequencies. LPC's provide a convenient method for the identification of the formants of vowels and vowel-like consonants.
Spectrograms
Spectrograms permit the examination of the dynamic changes in a speech spectrum. This is particularly useful for the examination of rapidly changing consonants (eg. stop bursts) and also for vowel transitions (between vowels and consonants and between the targets in diphthongs). Spectrograms, usually in conjunction with waveforms, are essential during the segmenting and labeling of speech. Spectrograms usually provide the clearest visual cues to the boundaries between phonemes. Spectrograms do not, however, provide accurate measurements of vowel formants as broad band spectrograms have a poor frequency resolution (about 300 Hz) and so there is a high degree of intrinsic error in formant measurements taken visually from spectrograms. That is why we tend to use FFTs and LPCs for the accurate measurement of formant frequencies.
Formants
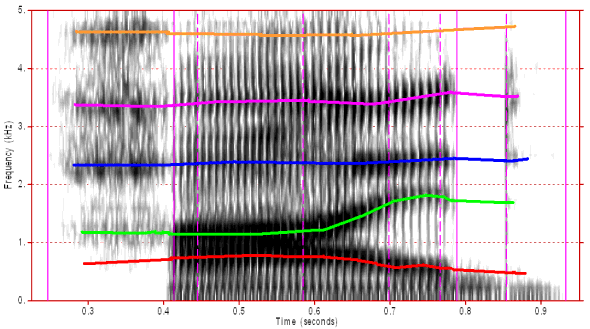
On very many speech acoustics packages, automatic formant tracking is a commonly used tool. Such tools generally superimpose a formant track (often colour coded) over the spectrogram. This often greatly facilitates the user's ability to identify the formants. Further, automatic formant tracking usually provides a set of formant values that can be analysed statistically in work on large speech databases.

Figure 1: This is a broad band spectrogram of the word "hide" with the formant tracks for formants 1 to 5 superimposed over it.
In figure 1, the formant tracks provide continuous plots of formant frequencies even over those parts of the spectrogram for which there is no displayed spectral energy (such as the stop occlusion above 1000 Hz). Unfortunately, most formant trackers are very error prone in voiceless fricatives and in oral stops and don't provide as tidy a set of formant tracks as those that appear here. Such formant trackers are quite accurate in vowels, but their accuracy decreases as we go from the most vowel-like consonants (ie. semivowels) to the least vowel-like consonants (ie. oral stops and voiceless fricatives).
Fundamental frequency plots
Fundamental frequency (F0) plots are essential when working with prosody, and particularly with intonation. We will use F0 plots extensively in this course when we examine the analysis of speech intonation. Until then, look at figure 7.19.3 (panel c) on page 298 of Clark and Yallop.
Intensity plots
Intensity plots are often useful in speech analysis. They can sometimes help to identify phoneme boundaries and can also be useful in the analysis of the intensity correlates of prosody. Figure 7.19.3 (panel b) of Clark and Yallop, shows a dB-scaled "short-term average" intensity plot for the word "Woolloomooloo". This root mean square average was taken using a contiguous series of short overlapping windows. Such overlapping windows are usually set so that each window is greater than the pitch period of the waveform. This permits the examination of the intensity profile without the interference of fluctuations in intensity caused by variations in voice source intensity during each glottal cycle.
Speech spectra and spectrograms
In this topic we will examine various aspects of speech spectrograms and spectra that you will encounter in this unit.
- Speech analysis programs
- Spectrogram settings
- FFT and LPC spectrum settings
- Some detailed views of "heed"
- Some vowel spectra
- Some consonant spectra
Some consonant spectra In the spectrograms discussed in this topic, clear formant tracks are marked with yellow lines. Formant transitions (movements) from a consonant to a vowel are important cues to place of articulation for many CV consonants. In this topic only CV consonants are illustrated. Consonants in other contexts (clusters, VC and VCV) are dealt with elsewhere.
The time scales are not constant in these diagrams. You are advised to take note of the time scale underneath each spectrogram before comparing temporal properties of the consonants.
FFT/LPC intensities are relative to an internally specified reference number. They should not be construed as signifying actual intensities in the original recording studio as this would require reference to an independent calibration signal. The dB values should only be interpreted as indicating relative intensities for spectrum components. For these particular spectra, -70 dB should be regarded as the floor or minimum level for these spectra and represents low level background noise. Such noise is a normal characteristic of the recording environment and the recording technology.
All of the spectrograms and FFT/LPC spectra used in this topic belong to the same adult male speaker of Australian English.
Content owner: Department of Linguistics Last updated: 13 Nov 2024 9:51am
