Standing Waves and Resonance
Resonance is a physical property of an object. All physical objects resonate. Some have simple, uniform resonance patterns and some have complex resonance patterns. Some resonators are highly damped and some are weakly damped.
Resonance and Sound
Sound may be produced as a consequence of resonance patterns within an object, but sound should not be confused with resonance. For example, a guitar string (of a fixed mass, length and tension) has a constant characteristic resonance pattern regardless of whether it is currently producing sound or not (eg. it is not vibrating, or it is vibrating within a vacuum).
Some resonators may generate sound by exciting adjacent air particles in the surrounding medium. For example, a guitar string vibrates upon being plucked. The vibrations of a guitar string are transverse vibrations (and are therefore NOT sound vibrations) with characteristic (resonant) frequencies determined by the physical properties of the string. The guitar string collides with the surrounding air and generates longitudinal pressure waves (sound) in that medium. The sound waves in the air have frequency patterns related to the frequency patterns of the vibrating string (and thus of the string's resonance characteristics) but the sound waveform of the resulting sound bears little obvious visual resemblance to the vibratory pattern of the string that generated it.
Figure 1: Sound waveform generated by a vibrating guitar high E string (329.6 Hz). Click on the image to hear the sound.
Figure 2: Sound waveform generated by a vibrating guitar low E string (82.4 Hz). This sound is two octaves lower than the previous sound. Click the image to hear the sound.
Some resonators (eg. the supra-glottal vocal tract) may act upon sound waves generated elsewhere (eg. at the glottis) and selectively permit some frequencies (the resonant frequencies) to pass unattenuated whilst causing other frequencies to be attenuated (reduced in intensity) to some extent.
Reflection, Interference and Standing Waves
When two wave pulses approach each other from opposite directions they pass through each other. As they do so their patterns interfere with each other either constructively or destructively to produce temporary composite patterns. The original wave shapes are then restored when the two wave pulses pass beyond each other. This principle is fundamental to two aspects of wave behaviour.
- Firstly, in a typical resonating medium waves may be passing randomly in every direction in complex three dimensional patterns. Whilst waves may temporarily interfere with each other they pass through each other intact.
- Secondly, some patterns of constructive and destructive interference are preferred by a resonating medium over other patterns. The preferred patterns of interference are related to the resonant characteristics of the medium.
Waves also interfere with themselves. This occurs when a wave is reflected off a surface or some other obstruction so that the reflected wave pattern interferes with the original (unreflected) wave pattern.

Real World - Imaginary Reflection on right
Figure 3: In this animation the vertical black line represents a solid barrier. The area to the left of this barrier is the real world whilst the area to the right of the barrier is an imaginary reflected world. Wave pulses on the left hand side are real whilst wave pulses on the right hand side are exact, but imaginary, reflections of the real wave pulse. When a wave reflects without inversion there is constructive interference and therefore significant particle displacement at the barrier. The pulse moving to the right is light green and the pulse moving to the left is light blue (cyan). The addition of the incident and reflected pulse is shown in black.

Real World - Imaginary Reflection on right
Figure 4: In this animation the vertical black line represents a solid barrier. The area to the left of this barrier is the real world whilst the area to the right of the barrier is an imaginary reflected world. Wave pulses on the left hand side are real whilst wave pulses on the right hand side are exact, but imaginary, inverted reflections of the real wave pulse. When a wave reflects with inversion there is destructive interference and therefore no particle displacement at the barrier. The pulse moving to the right is light green and the pulse moving to the left is light blue (cyan). The addition of the incident and reflected pulse is shown in black.
Wavefront Reflection With and Without Inversion
Reflection without inversion always occurs, except when reflection with inversion is forced by a fixed end. Reflection with inversion must occur at fixed ends as that is the only way to reflect the energy of the wavefront without creating movement at the fixed point.
Standing Waves in Strings
When a string is fixed at both ends (eg. guitar or piano) then the two ends are not free to move. When a wave front is reflected it must reflect with inversion (see figure 4) so that the resultant wave interference pattern always maintains zero displacement at each barrier.
There are possible exceptions to this for vibrating strings, but they would only exist when one end of the string is not firmly fixed to the barrier and that end is free to move (eg. the end of a whip being "cracked" or when one end of a string is attached to a small ring that is free to slide up and down a vertical metal rod). In such cases there is a particularly strong displacement at the free end of the string because constructive interference occurs. In all cases where the end of the resonating body is free to move wave reflection occurs without inversion.
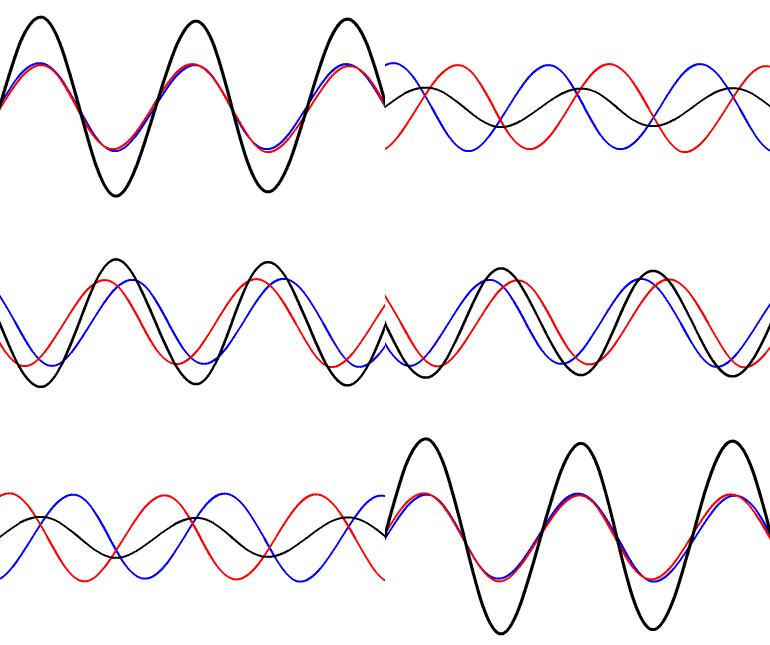
Figure 5: In this animation a string (black curve) is firmly attached on both sides. The original waveform is constantly being reflected back and forth with inversion at the two barriers. Only original waves with wavelengths that result in zero displacement of the resultant wave at each of these barriers are able to vibrate. All other waves are very strongly attenuated. In this example the distance between the barriers is equal to 1.5 times the wavelength of the wave.
In figure 5, close examination will reveal that there are four points, in addition to the two points of attachment, where the displacement of the resultant (additive) wave is always zero. These points are referred to as nodes. Additionally, there are five points where the string moves between maximum positive and negative displacement. These points are referred to as anti-nodes. Waves, such as this, which have fixed nodes and anti-nodes are referred to as standing waves and standing waves are central to the phenomenon known as resonance.
What are the possible wavelengths for a string fixed at both ends that result in standing waves with nodes at both ends?
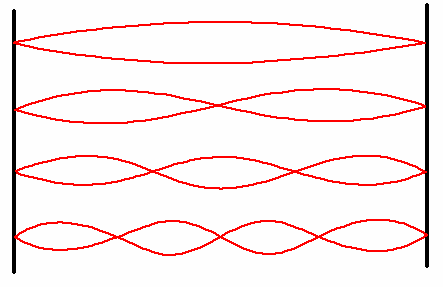
Figure 6: This figure illustrates the first four wavelengths that would result in nodes at the two fixed ends. In descending order, the wave's wavelength is 2L, L, 2L/3, L/2, where L is the length of the string.
In figure 6, we can see the wavelengths of the first four resonant frequencies for this string. These wavelengths all result in standing waves with nodes at the two fixed ends. These, and all additional wavelengths, can be determined using the following formula:-

so, wavelength #1 (ie. n=1) results in the value 2L/1, or 2L, etc...
How does this relate to frequency? Well, remember that:-

where "c" is the speed of sound, or more generally, it is the velocity of propagation of a wavefront.

So, for a string fixed at both ends, the resonance frequencies are all multiples of the first resonance frequency which can be calculated if we know both the length L of the string and the velocity of wavefront movement.
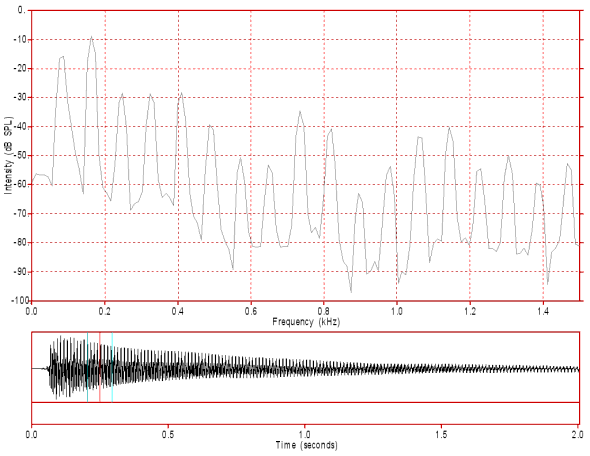
Figure 7: This is the waveform (bottom) and the spectrum of the sound induced by the vibration of the low E string of a guitar. The peaks are the first 18 resonances for this string and the first resonance is very close to the expected theoretical frequency of 82.4 Hz for this low E note. All of the higher resonances represent all integer multiples of the lowest resonance. The length of this guitar string is 64.4 cm or 0.644 m. Click the image to hear the sound.
The example in figure 7 gives us f1= 82.4 Hz for string length L = 0.644m. From these values and the formula (derived from the last formula):-

we can determine the speed of propagation of wave fronts on this string as 106 m/s. Note that this is not the same as the speed of sound in air. Further, we are talking about the propagation of transverse waves in a string rather than the propagation of longitudinal pressure waves (sound).
Let's look at another example:-
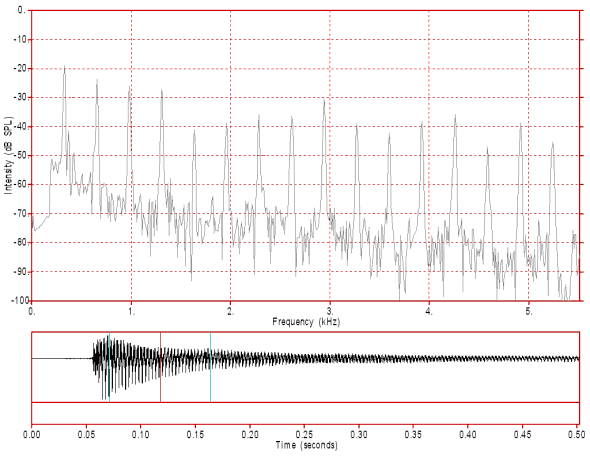
Figure 8: This is the waveform (bottom) and the spectrum of the sound induced by the vibration of the high E string of a guitar. The peaks are the first 16 resonances for this string and the first resonance is very close to the expected theoretical frequency of 329.6 Hz for this high E note. All of the higher resonances represent all integer multiples of the lowest resonance. The length of this guitar string is the same as the previous string, which is 64.4 cm or 0.644 m. Click the image to hear the sound.
Using the same procedure as for the example in figure 7, we can determine the speed of propagation of wave fronts on this string as 424 m/s.
Note that the two strings are the same length but that the example in figure 8 has 4 times the first resonance and speed of wavefront propagation as does the example in figure 7.
So, why are they different? The low frequency string is thicker and has lower tension than does the higher frequency string. These two properties result in differences in wave propagation speed in the two strings even though the wavelengths of each of the resonances are identical. The string with the lower mass and higher tension vibrates faster and induces higher sound frequencies in the surrounding air medium than is the case for the string with the higher mass and lower tension.
If you examine the waveforms at the bottom of each of figures 7 and 8 (carefully noting the differences in scale), you will see that the higher frequency wave (figure 8) dies out about four times as fast (about 0.5 secs) as does the lower frequency wave (figure 7; 2.0 secs). This suggests that each string vibrated about the same number of times before dying out. When measuring damping, it is better to consider the number of vibrations that occur rather than the actual time taken before an oscillation dies out. From this perspective, in 0.5 seconds the higher frequency string vibrated 164.8 times (329.6 x 0.5) and in 2 seconds the lower frequency string vibrated 164.8 times (82.4 x 2) and so the two strings can be considered to have equivalent damping.
Standing Waves in Tubes
Uniform non-branching tubes can be classified into three types when determining standing wave patterns:-
- tubes closed at both ends
- tubes open at both ends
- tubes open at one end and closed at the other
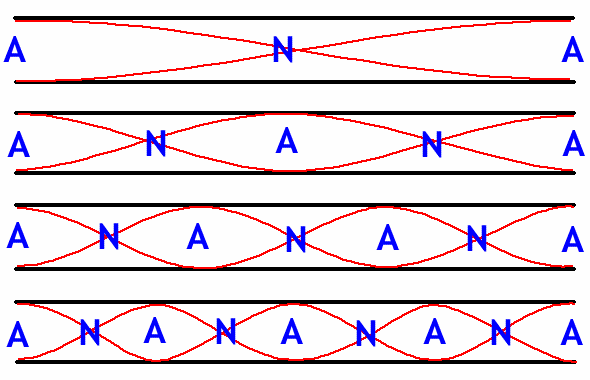
Figure 9: Standing wave patterns for the first four resonances in a tube open at both ends. Nodes ("N") and anti-nodes ("A") are indicated. Note that the same pattern occurs for tubes closed at both ends except that the positions of the nodes and anti-nodes are reversed.
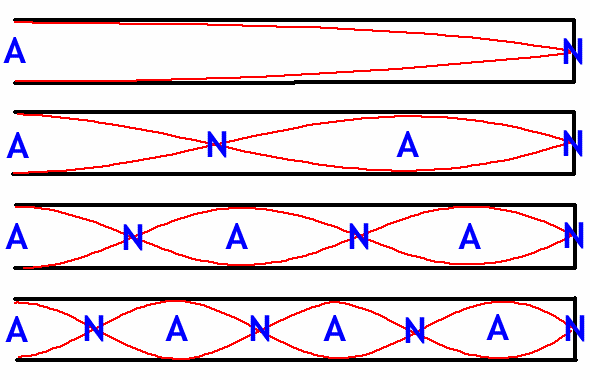
Figure 10: Standing wave patterns for the first four resonances in a tube open at one end and closed at the other.
Of these three types of tubes, the ones depicted by figure 10 are of most relevance to speech production. The vocal tract during the production of vowels and vowel-like consonants can be described as a tube open at one end, the mouth, and closed at the other, the glottis. During vowel production the periodic opening and closing of the glottis is so small compared to the opening at the lips that it can be ignored and effectively treated as closed. We will examine the effect of constrictions in such tubes in another topic and will concentrate only on resonance in single uniform tubes in this topic.
Tubes closed at both ends might characterise resonance in the vocal tract during the occlusion phase of pre-voiced stops. In such tubes, however, only low frequency sounds escape by radiating through the walls of the vocal tract. Tubes open at both ends might characterise side chambers such as the nasal cavity during the production of nasalised vowels, for example, but their resonance is acoustically coupled to that of the main cavity which still is typically a tube open at one end and closed at the other. For that reason we will concentrate on tubes of the type displayed in figure 10 for the remainder of this topic.
Resonance in a tube of uniform cross-sectional area is a physical characteristic of that tube and is dependent upon the length of that tube and the open or closed state of the two ends. Resonances of the tube itself can only be defined in terms of wavelengths. What actually vibrates, however, is the medium contained in that tube. Only when we have defined the medium that vibrates in the tube can we talk about resonance in terms of frequencies. In the vocal tract this is nearly always defined by a body of air in which sound travels at about 330 m/s. For more information on the speed of sound.
The sole practical exception to this is heliox (oxygen/helium mixtures) used by deep sea divers. Heliox mixtures significantly change the speed of sound relative to normal air. Heliox causes an increase in the speed of sound which results in an increase in resonance frequencies for given resonance wavelengths (equivalent to effect of increasing string tension or reducing string mass for string vibration). Hear a sample of diver's speech under the influence of heliox.
Why Do We Have Standing Waves in Tubes?
In the case of vibrating strings with fixed ends, the molecules of the string are closely and tightly bound to each other and thus to the points of string attachment. This closely constrains resonance frequencies to only those wavelengths that result in nodes at the fixed ends. If we examine the peaks in figures 7 and 8 we see that these resonance peaks have a very narrow bandwidth (about as small as the FFT resolution will display). Further, the background noise is typically more than 30 dB below the resonance peaks. This suggests that only those frequencies precisely predicted by our formulae have been permitted to occur and all intermediate frequencies have been prevented from vibrating.
This isn't the case, however, when we have a column of air vibrating in a tube. Air is a gas and interaction between adjacent molecules in a gas is much more tenuous. This would suggest that it should be possible for other frequencies to occur in addition to the predicted resonance frequencies. Before we answer this question we will examine the spectrum of the Australian English tense central vowel (as found in the word "heard") as this vowel is produced with a vocal tract fairly closely approximating a uniform cross-sectional area tube.
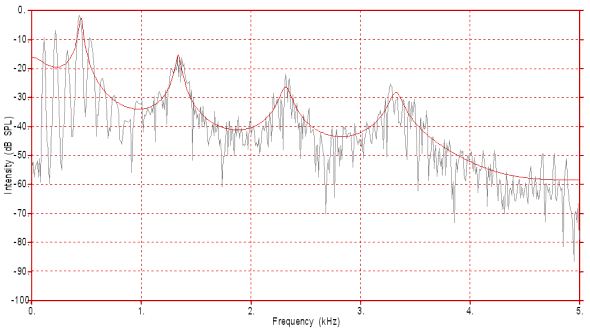
Figure 11: This is the of the vowel in the word "heard" spoken by a native speaker of Australian English. The resonance peaks are shown by the LPC curve (in red). Click the image to hear the sound.
If you examine figure 11 you should clearly see that there are four visible resonance peaks approximately at odd multiples of 450 Hz (this isn't an exactly uniform tube so the resonances aren't exact multiples of the first resonance). More importantly, for the current discussion, these peaks are very broad when compared with the guitar string resonance peaks in figures 7 and 8, above. Additionally, the vertical distance between peaks and intervening dips is about 20 dB, whereas in figures 7 and 8 it was at least 30 and often 40 dB. This suggests that there is some chance of frequencies between the resonant frequencies being transmitted by a tube containing a body of air. Nevertheless, there are clear resonant peaks and these would be at those frequencies predicted by a standing wave model of vocal tract resonance.
So, it is clear that we have resonance frequencies and that these appear to conform with the standing wave model of vocal tract resonance. But why do we have such resonances and why are the resonance peaks broader and less selective than those that occur for vibrating strings?
Nodes at the Closed End
Firstly, air has viscosity or resistance to movement caused by the crowding of air molecules. Further, viscosity increases as we approach the closed end of the tube or the walls of the tube (because of friction between air particles and the tube wall). Movement of air particles at the closed end of the tube is resisted by both increased air viscosity and by collisions with the end of the tube. This makes the closed end of a tube approximately analogous to the fixed end of a string, so reflection of a wavefront at the closed end occurs with inversion, resulting in nodes at the closed end.
Anti-nodes at the Open End
Why do we have anti-nodes at the open end of a tube? Waves can be reflected, not only at the closed end of a tube, but also at the open end of a tube. Reflection occurs at the open end of a tube as a consequence of a phenomenon called radiation impedance, which occurs when a tube suddenly opens into a much larger space. Movement of air particles is not inhibited as it is at the closed end of the tube and so wave reflection occurs without inversion and anti-nodes are created at the open end.
Standing Waves in a Tube
The closed end of tube is not as precisely determined as is the fixed point at one end of a vibrating string. This is because the resistance to particle movement increases due to increasing viscosity as a wave approaches the end of the tube. For this reason the probability of wave reflection increases as the wave approaches the closed end of the tube ("Tc"). Reflection is most likely to occur precisely at the closed end of the tube but reflection can also occur, with rapidly decreasing probability, at very small distances from the end of the tube.
This probabilistic behaviour is even greater at the open end of the tube with maximum reflection occurring (for the vocal tract) at a point a little outside the lips ("Tl") and with a rapidly decreasing probability of reflection and therefore of anti-node creation for short distances on either side of this point.
As only waves with an anti-node at the open end and a node at the closed end can create standing waves, resonance frequencies are dependent upon the length of the tube. However, because the points of refection are not precise, but vary a bit at either end there is a range of apparent lengths that can result in resonances. The strongest resonances are those defined by the distance between the points Tc and Tl and these define the strongest standing waves. However, because of the uncertainty in the precise points of reflection, weaker standing waves can occur with frequencies either side of the main resonances. This results in broader resonance peaks (ie. greater bandwidth) than those which occur in vibrating strings.
Damping of Resonances
Weakly damped waveforms persist for a long time and their spectral resonance peaks are very narrow. The resonance peak of a tuning fork is very narrow and the waveform dies out very slowly. The same is true, but to a lesser extent, for vibrating strings on a guitar or piano.
The resonance peaks for a neutral vowel (produced with a uniform vocal tract) are quite broad. The broad bandwidth of the resonance peak, which results from factors discussed in the previous section, is directly related to the degree of damping. The broader the bandwidth, the greater is the degree of damping and so the resonance pattern generated by a single glottal pulse dies out very rapidly (say in about 10-20 ms).
Unlike the guitar string, phonation produces additional pulses of sound periodically. For the speaker in figure 11, with an F0 of about 110 Hz (9 harmonics between 0 and 1000 Hz), a new glottal pulse is being generated approximately every 9 ms. This speaker has a vocal tract with a length of about 17 cm. In 9 ms a wavefront traveling at 330 m/s (the speed of sound in air) can travel about 3 m. That is about 18 times the length of this speaker's vocal tract. In about the time it takes a single glottal pulse to be replaced by the next glottal pulse the wave can be reflected back and forth about 18 times to produce a strong standing wave pattern even though the resonances are much more strongly damped than are the resonances of a guitar string.
Calculating Resonance Wavelengths and Frequencies
If we examine the standing wave patterns in figure 10, we can see that the first four standing waves represent waves with 1/4, 3/4, 5/4, and 7/4 cycles within the length of the tube. For a tube of length L this means that the first four resonance wavelengths are 4L/1, 4L/3, 4L/5, and 4L/7. If we know the speed of sound, we can calculate the frequencies of the first four resonances using the formula:-

from which we can derive this formula:-

Or, more easily, we can determine the first resonance using:-

and then determine each odd multiple for subsequent resonances. So, if the first resonance is 500 Hz then the next three resonances are, 1500, 2500 and 3500 Hz.
Another explanation of the calculation of tube resonances.
Resonances and Formants
Resonances are vibratory characteristics of a resonating body. In the case of an air filled tube the resonance characteristics exist even when there is no sound being produced. When we produce vowel sounds the resonances of the vocal tract selectively enhance sound vibrations close to the resonance frequencies and selectively attenuate sound vibrations remote from the resonance frequencies. This results in peaks in the acoustic spectrum of the resulting speech sound. These acoustic spectral peaks are called formants, particularly when they occur in vowels and vowel-like consonants.
References
- Clark and Yallop, section 7.13, pp243-245
- Harrington and Cassidy, section 3.3
Content owner: Department of Linguistics Last updated: 13 Nov 2024 9:52am


