Sound Sources in the Vocal Tract
Phonation
Periodic vibration of the vocal folds is known as phonation. Phonation provides the periodic sound source for all voiced speech sounds.
Changes in the settings of the muscles of the larynx can affect the rate of phonation (the fundamental frequency or F0) as well as the mode of vibration. Modes of vibration include "modal" phonation as well as breathy voice, creaky voice, falsetto voice, and certain pathological modes of vibration.
The glottis is the opening in the larynx that exists anteriorly (to the front) between the vocal folds and posteriorly (to the back) between the arytenoid cartilages. The part of the glottis between the vocal folds is known as the membranous glottis and the part of the glottis between the arytenoid cartilages is known as the cartilaginous glottis.
The vocal folds must be closed and the ratio of air pressure below the glottis (subglottal) to air pressure above the glottis (supraglottal) must exceed a certain positive value for phonation to occur. In other words, subglottal pressure (Psg) must exceed supraglottal pressure by a certain amount for phonation to occur.
In modal phonation the cartilaginous glottis must be closed to prevent leakage of air typical of breathy voice. The vocal folds are adducted (held together) and a certain amount of tension is applied to the vocal folds. Extremes of length, thickness and tension can result in creaky voice (short, thick, low tension vocal folds) or falsetto voice (elongated, thin, high tension vocal folds).
Forces of exhalation cause a build up in air pressure below the closed glottis. Phonation occurs when Psg reaches a certain value (dependent upon vocal fold tension). The air pressure forces the vocal folds apart when the force of the air pressure exceeds the elastic forces holding them closed. This causes Psg to drop as air escapes from below the glottis. When Psg drops to a certain level, elastic and aerodynamic forces cause the vocal folds to snap shut again. Psg then builds up again and the cycle is repeated. This pattern is repeated to create a periodic series of glottal opening and closing patterns. During phonation each cycle can be characterised by a closed and an open phase.
The vocal folds are somewhat analogous to the stretched vibrating strings discussed in the resonance topic. In that topic, it was explained that a string stretched between two fixed points collides with and induces vibrations in the surrounding air. In the case of the vocal folds, however, the main source of sound generation is from air turbulence caused by air passing rapidly through the glottis during its open phases. The rate and pattern of opening and closing of the vocal folds is related to the mass, tension and length of the vocal folds. The pattern of glottis opening and thus of airflow is related to the characteristic vibratory patterns of the vocal folds (ie. to the complex resonance characteristics of the vocal folds).
Glottal Flow
Glottal flow is the flow of air through the glottis. During phonation glottal flow is zero during the closed phase and typically (ie. during modal phonation) flow increases more slowly during the opening phase than it decreases during the closing phase so that in plots of glottal flow the closing phase usually has a steeper slope than the opening phase.
Glottal flow is usually measured as volume velocity or the volume of air that passes through an opening per second (eg. in cubic centimetres per second - cm3/s (1)). Typical peak rates of glottal flow for an adult male during phonation, range between 300 and 500 cm3/s, whilst average glottal flow rates across multiple full glottal cycles are typically less than 100 cm3/s (Rothenberg, 1968). The length of the glottis is about 17 to 22 mm in adult males and about 11 to 16 mm in adult females (Clark and Yallop, 1995, section 6.5). During modal phonation the maximum opening of the glottis during a glottal cycle would have a cross-sectional area of approximately 0.1 to 0.2 cm2 (which is similar to the cross-sectional area of supraglottal constriction during the production of a fricative). The relationship between airflow volume velocity and the cross-sectional area of glottis opening is such that turbulence and therefore noise generation occurs during the whole open phase of a glottal cycle (see the section on Aperiodic Sound Sources, below, for more information on turbulence and noise generation).
The shape a glottal flow pulse is very similar to the shape of the acoustic waveform generated at the glottis for each glottal cycle.
Synthesised Glottal Source Sounds
In the following examples we use glottal source sounds generated by a speech synthesiser using the polynomial section functions of Rosenberg (1971).
In figure 1 you can see a synthesised model of a glottal pulse and its spectrum. This synthesised glottal pulse would resemble a glottal pulse in modal phonation.
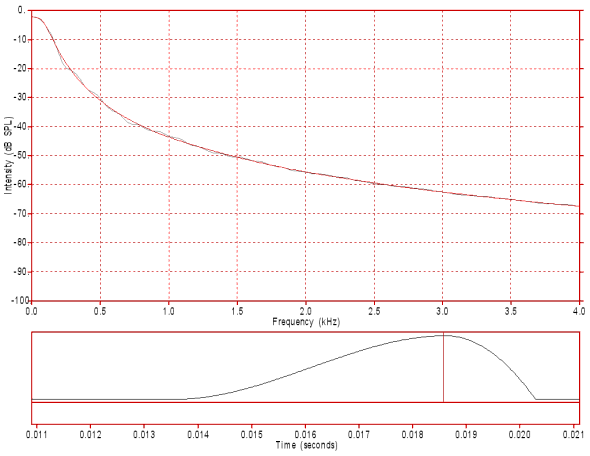
Figure 1: A single synthesised glottal pulse waveform (bottom) and its spectrum (top). This glottal pulse has a rise (opening phase) time of about 5.0 ms and a fall (closing phase) time of about 1.7 ms (opening to closing ratio of about 3:1).
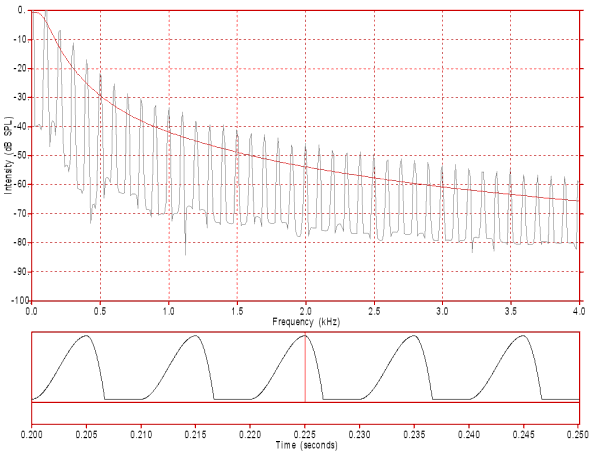
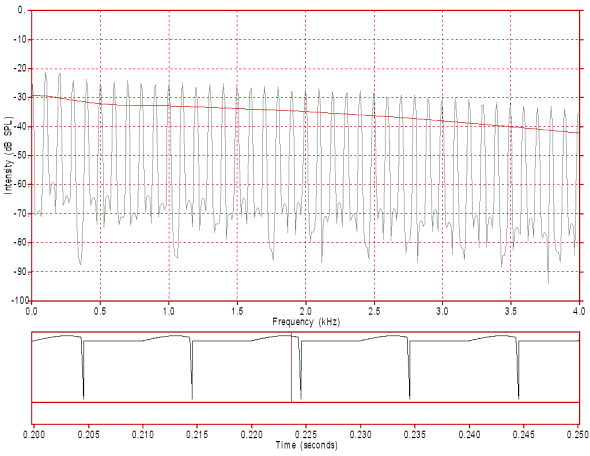
The nature of phonation is such that glottal pulses occur as a series of pulses. If vocal fold mass, tension and length as well as expiratory force from the lungs are held constant then the series of pulses have identical shape and repeat with a constant fundamental frequency (rate of pulse repetition), as illustrated by the synthetic pulse train in figure 2. Note that the spectral envelope (illustrated by the LPC curve, in red) is the same as the spectrum of the single pulse in figure 1 as the spectral envelope is dependent upon the shape of the glottal pulse(s).
Note, however, that when a pulse is repeated periodically that the detailed spectrum (illustrated by the FFT plot in black) is a harmonic spectrum with the first peak at the fundamental frequency (100 Hz in this case - ignore the peak at 0 Hz) and subsequent peaks (harmonics) at all multiples of 100 Hz. You should also note that if the fundamental frequency was, for example, 150 Hz the harmonics would be 1.5 times as far apart but the spectral envelope would remain the same if the glottal pulse shape remained the same.
Figure 2: The waveform (bottom) and spectrum (top) of a periodic series of synthesised glottal pulses simulating modal phonation. Each glottal pulse is identical to the pulse in figure 1 and the glottal pulses occur at the rate of 100 per second. Each glottal cycle has an open phase of 6.7 ms and a closed phase of 3.3 ms for a total glottal cycle of 10 ms. Another way of expressing this is to refer to this as an open quotient of 0.67 (ie. 67% of the cycle is open). Click on the image to hear the sound.
In figures 1 and 2 the slope of the spectrum is approximately -12dB/octave. This means that for each doubling of frequency (e.g. 0.5 to 1.0, 1.0 to 2.0 and 2.0 to 4.0 kHz) the intensity of the spectral envelope decreases by 12 dB (The spectral envelope drops from
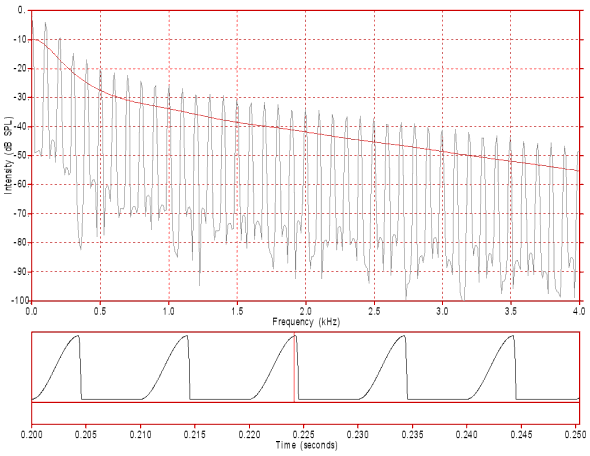
Figure 3: The waveform (bottom) and spectrum (top) of a periodic series of synthesised glottal pulses simulating a "bright" or loud voice. The glottal pulses occur at the rate of 100 per second and each glottal cycle has a period of 10 ms (0.01 s). These glottal pulses have a rise (opening phase) time of about 4.3 ms and a fall (closing phase) time of about 0.25 ms (opening to closing ratio of about 17:1). Each glottal cycle has an open phase of 4.55 ms and a closed phase of 5.45 ms for a total glottal cycle of 10 ms. That is, it has an open quotient of 0.455 (45.5%). Click on the image to hear the sound.
In figure 3 the slope of the spectrum is approximately -9dB/octave. This means that for each doubling of frequency the intensity of the spectral envelope decreases by 9 dB (The spectral envelope drops from
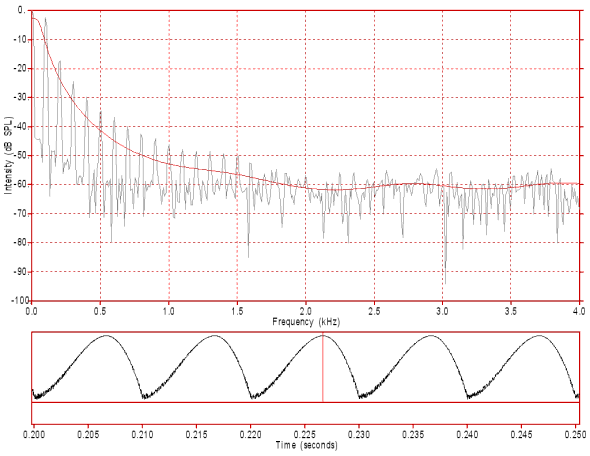
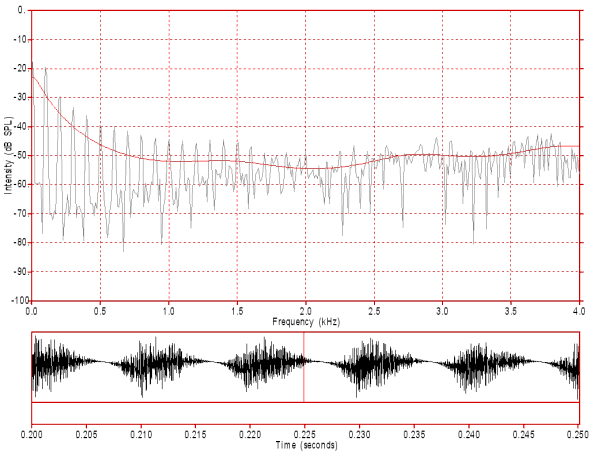
Figure 4: The waveform (bottom) and spectrum (top) of a periodic series of synthesised glottal pulses simulating a very breathy voice. Note the noise in both the waveform (particularly in the dips) and the spectrum (particularly above 1.6 kHz). The glottal pulses occur at the rate of 100 per second and each glottal cycle has a period of 10 ms (0.01 s). These glottal pulses have a rise (opening phase) time of about 6.67 ms and a fall (closing phase) time of about 3.33 ms (opening to closing ratio of about 2:1). Each glottal cycle has an open phase of 10 ms and a closed phase of 0 ms for a total glottal cycle of 10 ms. That is, it has an open quotient of 1.0 (100%). Click on the image to hear the sound.
In figure 4 the slope of the spectrum is approximately -15dB/octave. This means that for each doubling of frequency the intensity of the spectral envelope decreases by 15 dB (The spectral envelope drops from
Opening Quotient, Opening/Closing Ratio and Spectral Slope
The length, tension and mass of the vocal folds as well as the ambient Psg together determine the vocal quality and this is reflected by typical patterns of opening quotient (percentage of each glottal cycle that is open), opening/closing ratio and spectral slope for different vocal qualities.
For example, loud voice has higher Psg and this can only be supported by greater lateral compression of the vocal folds (to hold the greater pressure of air below the vocal folds). This increased force also causes the vocal folds to snap back more quickly. Further the greater Psg results in greater airflow through the vocal folds which increases the aerodynamic forces which also help to close the vocal folds even more rapidly. This results in a shorter glottal pulse and also in a much shorter closing phase (fall time) relative to opening phase (rise time). The more rapid changes in airflow and thus in sound level are reflected in the spectrum as increased levels of high frequency sound and therefore as a less steep spectral slope.
Lip Radiation
The head can be modeled as a sphere with a 9 cm radius and with the lips modeled as either a single point opening or as a small circular opening in the surface of the sphere (much like a spherical baffle which can be used to reduce the intensity of low frequency sounds). The sphere has a reflective surface that reflects high frequency sound more efficiently than low frequency sound. This causes the high frequency sounds to be increased, relative to low frequency sounds, by about +6 dB/octave.
"Effective Source Spectrum"
This lip radiation effect is quite independent of the source of a speech sound and an accurate model of speech production acoustics should apply the source spectrum, the vocal tract resonance filtering and then the lip radiation effect in that order. Nevertheless, when the goal is to particularly focus upon vocal tract resonance it is not uncommon to speak of an "effective source spectrum" which combines the effects of both the source spectrum and lip radiation. This permits an easier visual examination of the effects of vocal tract resonance.
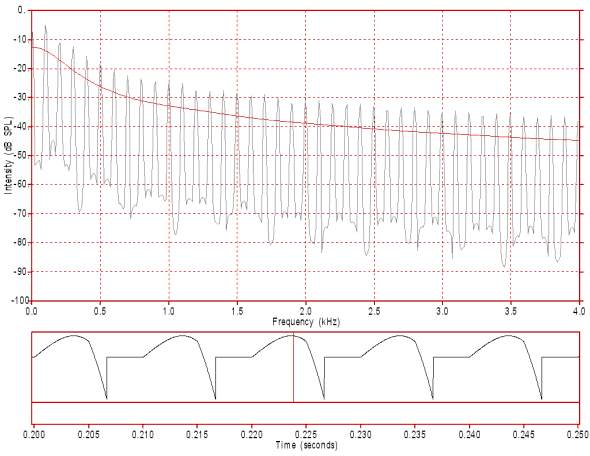
Figures 5 to 7 are the sources in figures 2 to 4 but with the lip radiation effect added. This effect uses a procedure called weighted differentiation and is designed to apply a +6 dB/octave tilt to the original source spectra. You should note that whilst this produces spectra with spectral slopes 6 dB/octave less steep than the original source spectra, it also produces a peculiar waveform that seems to bear little relationship to any measured waveforms. Nevertheless, as we shall see in the topic on Vocal Tract Resonance, when an appropriate vocal tract filter is applied to such a waveform, acceptable speech waveforms result.
Figure 5: This figure displays the spectrum and waveform of the modal voice source signal in figure 2 after differentiating to simulate lip radiation. The slope of the spectral envelope is now
Figure 6: This figure displays the spectrum and waveform of the bright/loud voice source signal in figure 3 after differentiating to simulate lip radiation. The slope of the spectral envelope is now
Figure 7: This figure displays the spectrum and waveform of the breathy voice source signal in figure 4 after differentiating to simulate lip radiation. The slope of the spectral envelope is now
Aperiodic Sound Sources
Aperiodic sound sources rely on the principle that for a given constriction cross-sectional area, significant turbulent noise generation occurs if the volume velocity of the air passing through it exceeds a certain value.
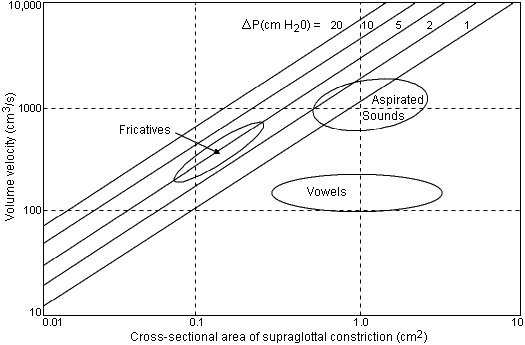
Figure 8: This figure shows the relationship between the cross-sectional area of a constriction and the volume velocity of air flowing through that constriction. A third dimension is also displayed using the oblique contour lines running from the lower left corner to the upper right corner of the graph. These lines indicate the difference in air pressure (ΔP) on either side of the constriction that would accompany a particular relationship between cross-sectional area and volume velocity. Also shown on this graph are the typical volume velocity, supra-glottal cross-sectional area and ΔP values for three classes of speech sounds. (after Stevens, 1972)
A close examination of figure 8 reveals the following points:-
- the cross-sectional area at the point of minimum constriction in speech is between about 0.08 and 4 cm2
- the volume velocity of air flow through a supra-glottal constriction in speech is between about 100 and 2000 cm3/s
- the difference in pressure (ΔP) across a constriction in speech doesn't exceed 10 cm H20 (2)
- aspirated sounds (stops and affricates) have a similar cross-sectional area to vowels but the volume velocity is about 10 times greater (due to the buildup of pressure behind the occlusion) and so turbulence is sufficient for sound generation
- fricatives have a smaller cross-sectional area at their maximum point of constriction than do vowels and stops/affricates during their aspiration phase. Because of their much smaller constriction fricatives do not require as much airflow for sound generation as does stop aspiration.
- vowels (which we already know are not characterised by supra-glottal noise generation) have a relationship between cross-sectional area of constriction and air volume velocity which does not result in sufficient turbulence for significant supra-glottal noise generation.
It should also be noted that noise can be generated at the glottis. Whisper and breathy voice involve a very small opening at the cartilaginous end of the glottis. Airflow though this opening is sufficient to produce aperiodic noise. Further, the glottis during phonation has a cross-sectional area during the open phase similar to the supra-glottal opening of fricatives. This generates turbulence which results in sound generation, but this sound generation is strongly coupled to the movements of the vocal folds and so produces a typical glottal flow pulse which is repeated periodically to produced a voiced sound. Note that figure 8 does not illustrate glottal opening data but only concerns itself with supra-glottal constrictions.
Aperiodic Sound Source Spectra
Fant (1960) and Stevens (1972) suggest that the spectrum of a frication sound source is relatively flat between 500 and 3000 Hz and drops off in intensity above and below these frequencies at about
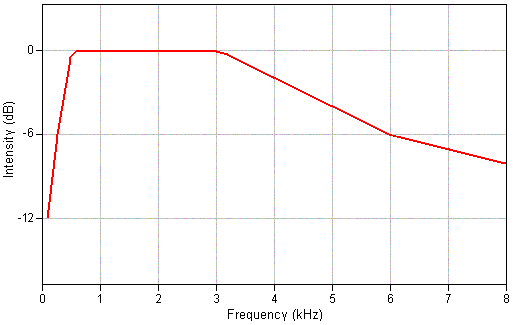
Figure 9: This is a stylised spectral envelope for a fricative sound source that is flat between 500 and 3000 Hz and that drops off by
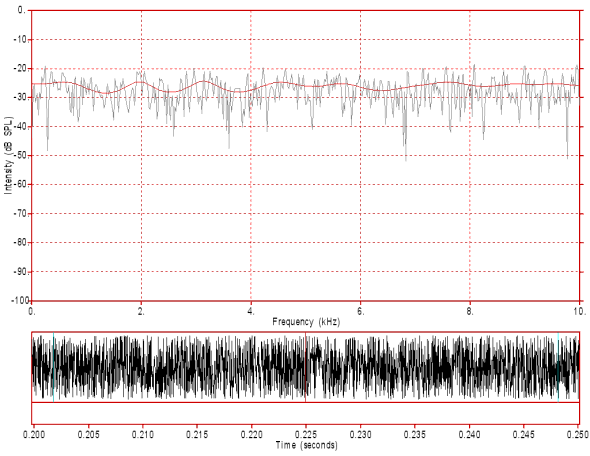
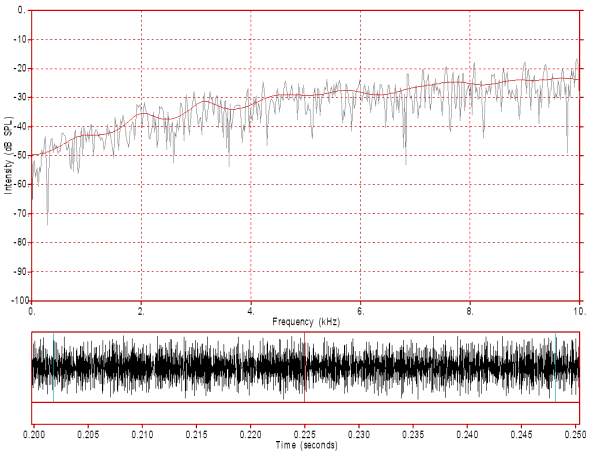
Whilst the spectral shape shown in figure 9 may be a better estimate of the actual spectrum of a fricative sound source, it is generally considered to be simpler to model a fricative sound source in speech synthesis using white noise (completely random noise with a flat spectral envelope). Such a sound source is illustrated in figure 10 and the "effective source spectrum" which takes into account the effects of lip radiation, is illustrated in figure 11.
Figure 10: White noise used as a simplified model of a fricative sound source. Note the random pattern of both the waveform (bottom) and the spectrum (top). Also note that the spectral envelope (LPC spectrum in red) is approximately flat. Click on the image to hear the sound.
Figure 11: Differentiated white noise used as a simplified model of a fricative sound source, but including the effects of lip radiation. Note the random pattern of both the waveform (bottom) and the spectrum (top). Also note that the spectral envelope (LPC spectrum in red) approximately has a +6 dB/octave slope. Click on the image to hear the sound.
Voiced Fricative Sound Sources
Voiced fricatives have two sound sources. One sound source is a voiced glottal source. The second source is an aperiodic sound source. The aperiodic sound source in voiced fricatives is, however, not a simple aperiodic sound source. The air stream that reaches the fricative constriction has passed through vibrating vocal folds. This means that the airstream is not a smooth continuous airstream but is rather an airstream that peaks and dips in its flow rate as the vocal folds open and close. This results in an aperiodic source being generated at the constriction that fluctuates periodically. This fricative sound source is said to be modulated by the voiced source and a synthesised modulated noise source is displayed in figure 12.
Figure 12: White noise source modulated by a voiced glottal source. Note that the amplitude of the noise source roughly follows the amplitude pattern of a voided glottal flow wave. Also note that the amplitude of the modulated noise source never completely drops to zero as the pressure difference above and below the constriction always remains sufficient to maintain noise producing turbulent airflow through the constriction. Careful inspection of the spectrum should reveal both noise components and evidence of a 100 Hz harmonic spectrum. Click on the image to hear the sound. Hear a differentiated version of this noise source .
The voiced source produced at the glottis also is mixed with this modulated noise source. High frequency components of the phonation source are attenuated by passage of the sound through the constriction, but lower frequency components do make their way into the anterior chamber where they mix with the modulated noise source. Further, audible low frequency components of the voiced source can also pass through the tissues of the vocal tract. Figure 13 displays a synthesised source that combines both the voiced glottal source and the voice modulated noise source.
Figure 13: This figure displays a composite source that combines the low frequency component of a voiced source plus a noise source modulated by the voiced source. Note, in particular, the strong harmonics below 1000 Hz as well as the weaker, modulation generated, harmonics mixed with noise at higher frequencies. Click on the image to hear the sound. Hear a differentiated version of this noise source.
Other Reading
- Clark and Yallop, sections 7.11-7.12
- Harrington and Cassidy, sections 3.2.1-3.22.
References
Listed below are references referred to in the above notes which are not required reading for this topic (unless otherwise stated).
- Clark, J.E. and Yallop, C., (1995), An Introduction to Phonetics and Phonology, Blackwell, Oxford.
- Fant, G., (1960), Acoustic theory of speech production, Mouton, The Hague.
- Rosenberg, A.E., (1971), "Effect of glottal pulse shape on the quality of natural vowels", J.Acoustical.Soc.Am., 49, 583-590.
- Rothenberg, M., (1968), The Breath-Stream Dynamics of Simple-Released-Plosive Production, Bibliotheca Phonetica VI (Basel, Karger).
- Stevens, K.N., (1972), "Airflow and turbulent noise for fricative and stop consonants: static considerations", J.Acoustical.Soc.Am., 50, 1182-92.
Footnotes
1. It should be noted that 1000 cm3 is equivalent to 1 litre and would fill a cube 10cm x 10cm x 10cm. Further, these air volumes assume atmospheric pressure at sea level even though the actual air pressure below a constriction is significantly higher than this.
2. Air pressure is often measured in terms of cm H20. Air at a given pressure can support a certain number of centimetres of water in device consisting of a glass U-tube column connected at one side to the air pressure being measured and at the other side to a know air pressure (such as atmospheric pressure).
Content owner: Department of Linguistics Last updated: 13 Nov 2024 9:52am

