Speech analysis programs
A print-formatted pdf file is available.
There are many software packages that permit the display of speech spectrograms and spectra. In this unit you will encounter displays generated by the "Emu" package (created by Steve Cassidy and colleagues) and the "MU-spec" program (created by Robert Mannell). In this topic we will mostly use images generated by MU-spec, but in some of the practical work as well as in some of the assessment you will also work with images generated by Emu.
a. Emu
In the following image you will see a spectrogram and waveform of the word "heed" generated by Emu. The word was spoken by an adult male speaker of general Australian English.
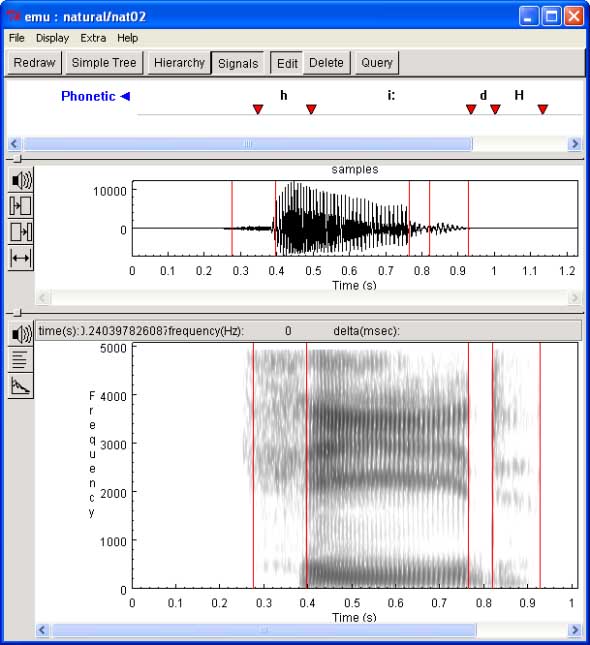
EMU display of "heed" displaying the label, spectrogram and waveform windows.
You should note that this image is divided up into three "windows". The top window is the label window. It displays phoneme boundary segment markers and labels for the phonemes in "heed". Note that the labels use the ANDOSL phoneme symbols for Australian English. Also note that there is a separate label ("H") for the release phase of the phoneme /d/. The label window displays existing labels, but it can also be used to generate new labels. Note that the horizontal axis is time and when the time axis of the label window aligns with the time axes of the spectrogram and waveform windows (see below) then the label segment boundary markers (the red triangles) align with the red lines on the spectrogram and waveform.
The middle window is the spectrogram window. It follows the normal convention of having frequency (in Hertz) on the vertical axis and time on the horizontal axis. Intensity is denoted by the darkness of the grey image. The three buttons to the left of this window are (from top to bottom) the play button, a button which displays a dialog box which permits the user to change certain settings, and a button which when pressed displays an FFT spectrum of the part of the speech sound selected by the user.
The bottom window displays the waveform of this speech file. Sound pressure is on the vertical axis and time is on the horizontal axis. The buttons on the left are a play button and three buttons which control zooming in and out on the waveform.
The time axis of the waveform, label and spectrogram windows can be synchronised with each other (as they are here) but this is not always the case with displays generated by Emu so you must take care to determine whether or not they are aligned.
The following image displays a sample FFT spectrum of the /i:/ vowel in "heed" as generated by Emu.
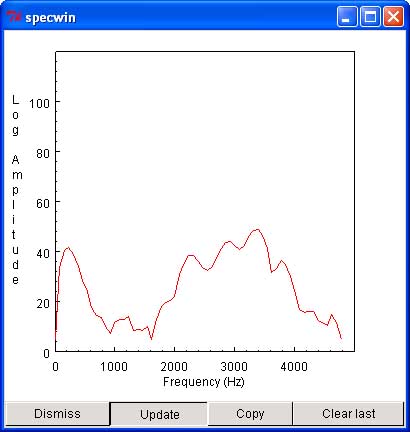
EMU FFT window displaying spectrum of /i:/ in "heed"
b) MU-spec
In the following image you will see a spectrogram and waveform of the word "heed" generated by MU-spec. This is exactly the same word that is displayed in the Emu image.
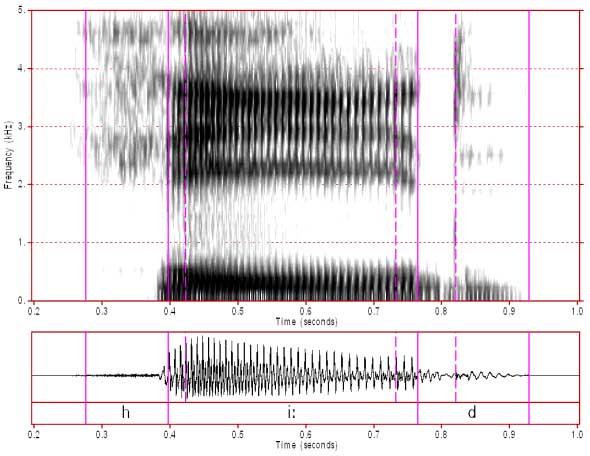
In this image the display is divided into two windows. The top window is the spectrogram window and has frequency (in kiloHertz, kHz) on the vertical axis and time on the horizontal axis. The bottom window is the waveform window. Additionally, the bottom of the waveform window displays segment labels. Note that the segment boundary lines for the spectrogram and waveform are always aligned for images generated with MU-spec. Note also that some additional markers (dotted lines) indicate certain features within each phoneme (in this case vowel transitions and the burst of /d/).
To display a combined FFT/LPC spectrum you click on the part of the waveform or spectrogram that you want to display (this displays a marker line, which is not shown here) and then a press of a certain button (also not displayed) displays the spectrum as shown in the following image.
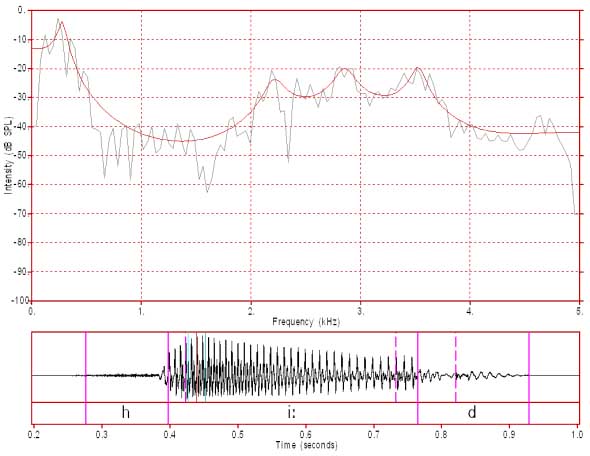
In this image the waveform and label window is unchanged whilst the spectrogram window is replaced by an FFT/LPC spectrum window. If you look closely at the waveform window you can see a pair of vertical light blue lines which indicate the start and end of the analysis window that was used to generate this spectrum. In the spectrum window the LPC is in red and the more detailed FFT is in grey. The vertical axis is the intensity axis (displayed in dB) and the horizontal axis is frequency (in kHz).
Content owner: Department of Linguistics Last updated: 12 Mar 2024 11:06am