Spectogram settings
A print-formatted pdf file is available
a) Topclip and depth
You should already be aware that intensity on spectrograms is indicated by grey-scale. To be more precise, any part of the spectrum that is above a certain pre-set level is displayed as black and anything below a second, lower, pre-set level is displayed as white. Spectral details between those pre-set levels are displayed as grey with darker greys nearer the upper level and lighter greys nearer the lower level. The upper and lower levels are often defined by two parameters knows as "top-clip" and "depth". Top-clip and depth are usually defined in deciBels and top-clip is relative to some pre-defined 0 dB level. In the next image, 0 dB has been defined as the very top of the image. A top-clip of -10 dB would be 10 dB below that level (as indicated on this image). Depth is relative to the top-clip line. A depth of 20 dB would place the lower grey-scale cutoff at the -30 dB level (ie. -10 - 20 = -30 dB). A depth of 30 dB would place the lower grey-scale cutoff at the -40 dB level.
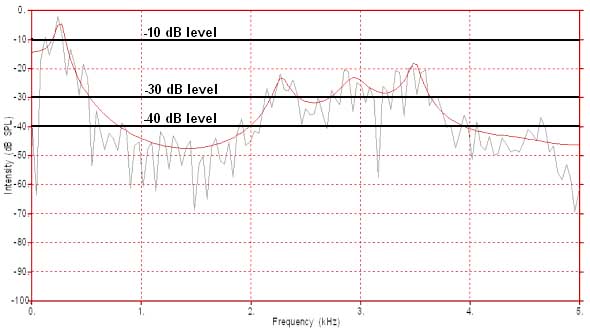
In MU-spec the default top-clip is -10 dB and the default depth is 30 dB. In the spectrum in this image that would mean that any spectral feature above -10 dB would display as black and any spectral feature below -40 dB would display as white. On the above spectrum the first formant peak at about 250 Hz would be completely black whilst the regions between about 800 Hz and 2000 Hz and between about 4000 Hz and 5000 Hz would be white. The three formants between 2000 Hz and 3600 Hz would display as a mid-grey. The next figure displays a spectrogram created using these settings. The position of the red vertical line (at about 0.52 seconds) is the approximate position of the spectrum in the above diagram. At that point in time the black, white and grey colours are as predicted above.
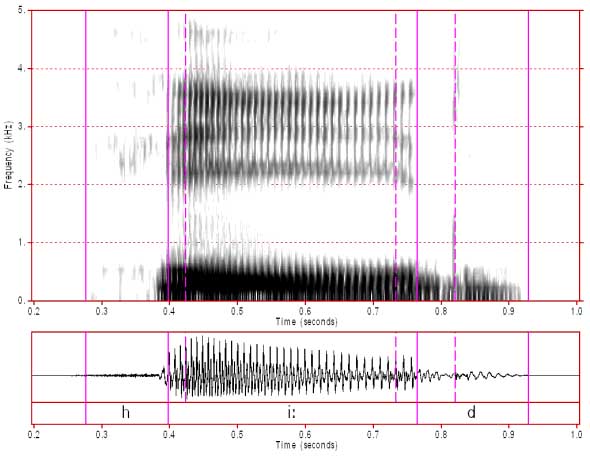
"heed":- No high-frequency pre-emphasis, top-clip -10 dB, depth 30 dB
b. High frequency pre-emphasis
One problem with the above spectrogram is that these settings result in a very intense (dark) first formant and much lighter coloured higher frequency formants. This tends to give the impression that the first formant is somehow more important than the higher formants. This is definitely not the case. The second formant is also very important for identifying vowels and the third formant may also be important in some vowel systems (especially those with spread versus rounded lip contrasts). A common way of dealing with this problem is to use a procedure called "high frequency pre-emphasis". This procedure is applied by default in MU-spec. In MU-spec the higher frequency components of the spectrum are effectively boosted when producing a spectrogram. Viewed another way, the 0 dB line can be said to be caused to drop off at -6 dB/octave above 500z (the exact settings vary from program to program). In the following diagram we can see the 0 dB line matching the 0 dB grid line up to 500 Hz and then dropping by 6 dB between 500 Hz and 1000 Hz, and by a further 6 dB from 1000 Hz to 2000 Hz and 2000 Hz to 4000 Hz (ie. it drops by 6 dB for every octave, or doubling of frequency). For a top-clip setting of -10 dB the top-clip line can be seen parallel to the 0 dB pre-emphasis line. The -30 dB (depth 20 dB) and the -40 dB (depth 30 dB) lines can also be seen on this graph.
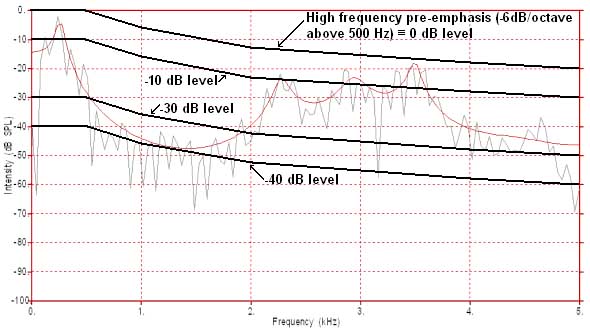
The default settings for MU-spec is to have high frequency pre-emphasis on and to also have a top-clip of -10 dB and a depth of 30 dB. That means that spectral features above the sloping -10 dB line are displayed as black on a such a spectrogram and spectral features below the sloping -40 dB line are set to white with features in between these lines set to grey. From this we can predict that for this point in time (at about 0.52 seconds) the first and fourth formants should be black and that the second and third formants should be close nearly black. The region between the first and second formant should be a very light grey and the fifth formant at about 4600 Hz should be a medium grey. In the following spectrogram we can see that this prediction is correct at 0.52 seconds.
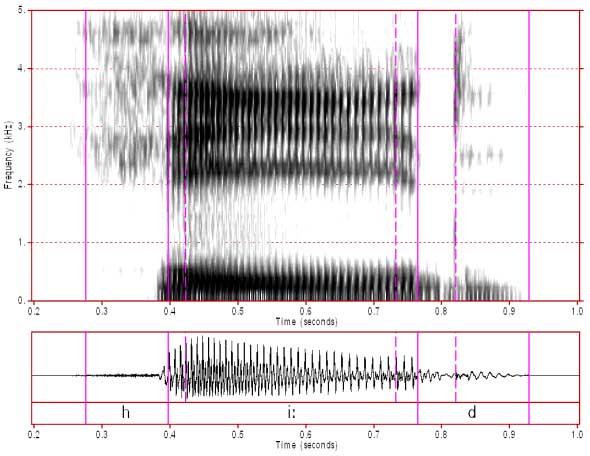
"heed":- High-frequency pre-emphasis, top-clip -10 dB, depth 30 dB
In the following spectrogram, high frequency pre-emphasis is on, the top-clip is set to -20 dB, and the depth is set (as before) to 30 dB. This results in a much darker spectrogram with the regions around all of the first four formants to be quite black. This setting has the effect of reducing the contrast between the vowel formants, but it also has the effect of highlighting the formant pattern in the release phase of the /d/. This suggests that different settings might actually be preferred for different speech sounds.
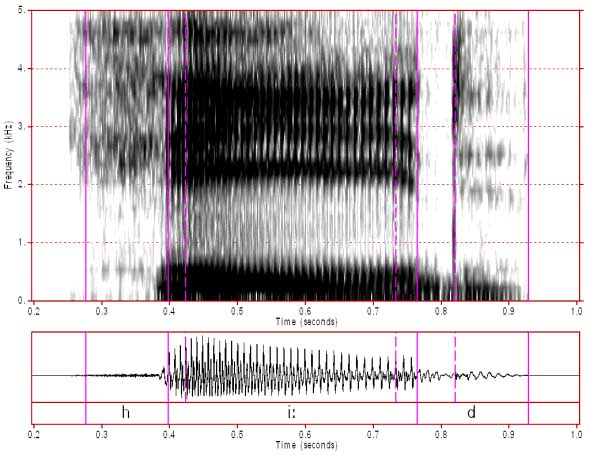
"heed":- High-frequency pre-emphasis, top-clip -20 dB, depth 30 dB
In general, high frequency pre-emphasis is desirable for displaying vowel spectra and the spectra of the more vowel-like consonants. Fricative spectra, on the other hand, have flatter spectra or have spectra that slope upward above 2000-3000 Hz. For that reason, it is often desirable to turn off high frequency pre-emphasis when the features of special interest are fricative spectra. In the preceding figure the spectrum of the /h/ appears to be more intense at higher frequencies. In reality, its spectrum is rather flat. In the next spectrogram we zoom in on the /h/ and set the spectrogram to have NO high frequency pre-emphasis, a top-clip of -20 dB and a depth of 30 dB. This setting more clearly shows that the spectrum between 0 and 1000 Hz has about the same intensity as the spectrum between 2000 and 5000 Hz.
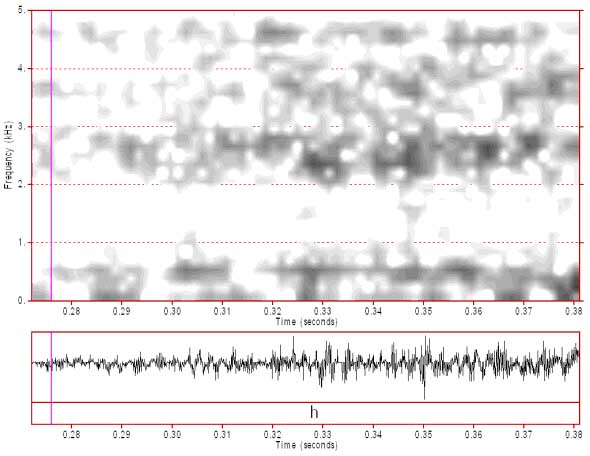
/h/:- No high-frequency pre-emphasis, top-clip -20 dB, depth 30 dB
Content owner: Department of Linguistics Last updated: 12 Mar 2024 10:49am
